Clemens Kielhauser, Julia S. Herrmann, Bryan T. Adey
2020
Article online
This paper presents a case study based on accident reports from the Zurich City Police. Using a joint GIS and time series analysis based on negative binomial regression, the data is analyzed to identify trends in accident development for several accident subgroups (e.g., bicycle accidents, senior citizen accidents, e-bike accidents) and specific locations.
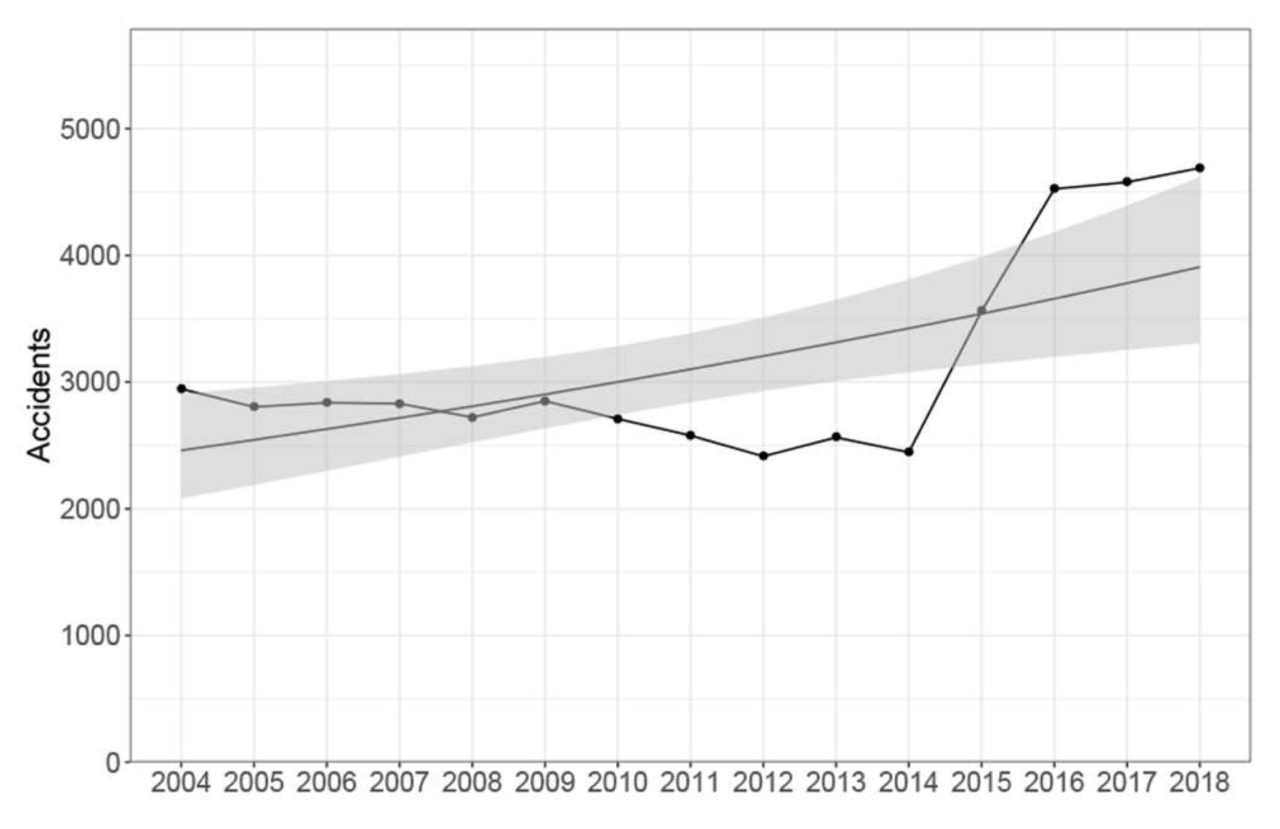
In order to be effective, road safety officers must have a complete overview of the accidents in their area of responsibility, including information pertaining to the location and severity of the accidents, and how the number of accidents are developing over time. Ideally, this information is stored in a Geographic Information System (GIS) enabled database, which helps to facilitate data processing and analysis, which enables improved understanding of the reasons for the accidents and the proposals of how to improve road safety. This paper presents a case study based on accident reports from the Zurich City Police. Using a joint GIS and time series analysis based on negative binomial regression, the data is analyzed to identify trends in accident development for several accident subgroups (e.g., bicycle accidents, senior citizen accidents, e-bike accidents) and specific locations. The subgroup of bicycle accidents will be discussed in more detail. The time series analysis is corrected for exposure (e.g., the increasing number of e-bikes) and forecasts the number of accidents which are likely to occur in the future. Significantly higher numbers of accidents than those expected serve as an early warning that further investigation, leading to possible interventions, is required. The case study shows that with this information, it is possible to identify both geographical areas and accident subgroups that have deviating patterns in accident numbers, and should be further investigated. For bicycle accidents, 4 out of 12 districts exceed the average accident trend by over 95% and 3 districts have an accident number that is over 10% higher than that district’s forecast, with the highest being 33% above the already increasing accident trend. Other accident subgroups are presented in summary form. The results of the analysis allow consistent and automated analysis across all potential areas for improving road safety, helping to focus the efforts of road safety managers on those areas where their efforts are most effective.
In: Special Issue: Advances in Road Safety Planning, in Frontiers in Sustainable Cities – Governance and Cities, 2, Article 21, DOI: 10.3389/frsc.2020.00021.